

Water uniformity tool helps farmers identify savings
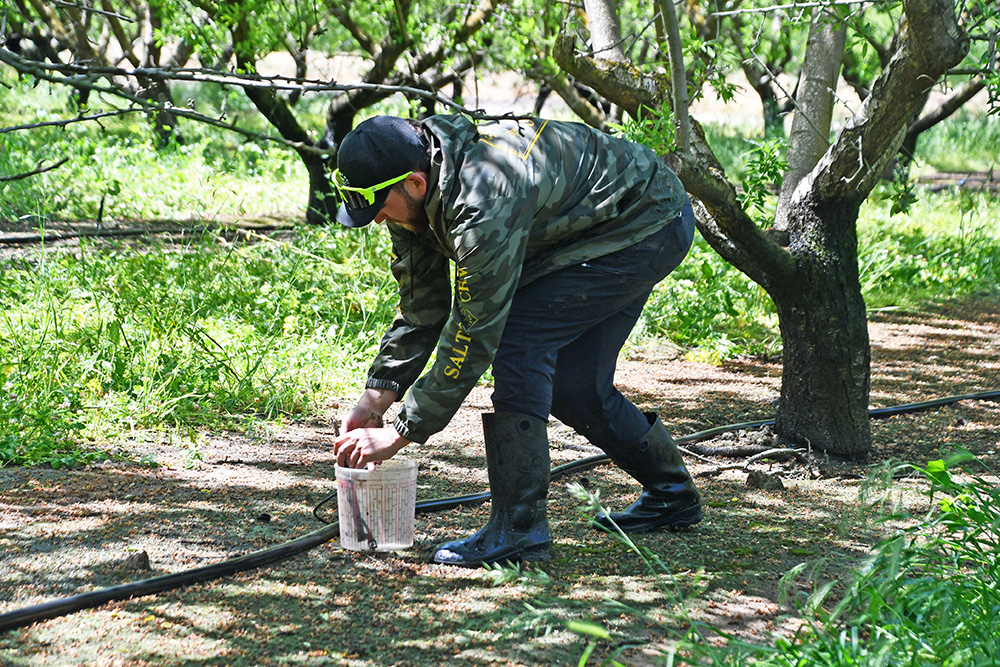
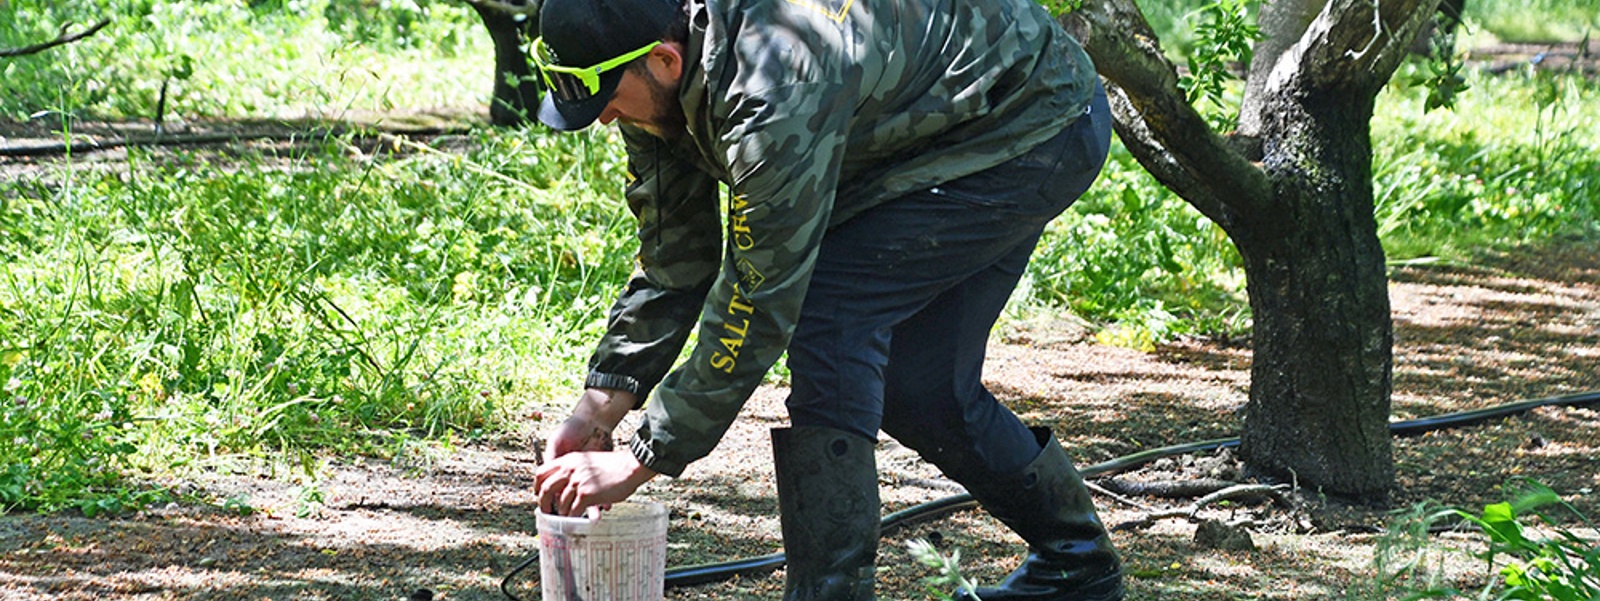
Victor Jacobs, an agricultural research manager for the East Stanislaus Resource Conservation District, conducts an irrigation audit to measure distribution uniformity.
Photo/Vicky Boyd


By Vicky Boyd
A recently launched online computer program not only helps producers determine whether irrigation systems are applying water uniformly but can also estimate the cost of wasted energy, water and fertilizer.
Dubbed the Distribution Uniformity and Return-on-Investment Estimator, the free program is the work of irrigation experts Jim Anshutz and Inge Bisconer. Distribution uniformity refers to how evenly an irrigation system applies water throughout a field or orchard.
![]() The online estimator identifies areas of an irrigation system needing maintenance, repairs or upgrades to improve distribution uniformity. It also translates the distribution uniformity score into an estimated financial return on investment based on estimated water, energy and fertilizer savings as well as estimated potential yield improvements.
The online estimator identifies areas of an irrigation system needing maintenance, repairs or upgrades to improve distribution uniformity. It also translates the distribution uniformity score into an estimated financial return on investment based on estimated water, energy and fertilizer savings as well as estimated potential yield improvements.
Statewide, the impacts could be huge, Anshutz and Bisconer said. California has more than 4 million acres irrigated with low-flow microsprinkler and drip irrigation. Of those, about 3.4 million acres have not been tested.
Of the roughly 5,400 drip and microdistribution uniformity evaluations conducted, more than 60% received low or poor scores, and many of those have not been upgraded.
While improving distribution uniformity potentially impacts producers’ profitability, it also may affect the environment by reducing the amount of nitrogen potentially leaching below the root zone and into groundwater, Anshutz said.
The simplified distribution uniformity and return-on-investment protocol is based on methodology developed by Cal Poly, San Luis Obispo, in the 1990s and long considered the industry standard. The protocol covers pressurized irrigation systems, including drip, microsprinklers and solid-set sprinklers.
Distribution uniformity testing involves measuring the output of the selected emitters, jets, microsprinklers or sprinklers in a field or orchard for a specific amount of time. It also includes testing system pressure at given points.
But Anshutz said collecting the data using the older protocol in a large field or orchard may require several days, and producing a grower report may take weeks because of lengthy data analysis. Since the distribution uniformity score isn’t translated into financial terms, even after growers receive the reports, they may not fully understand what the readings mean relative to the need for system improvements.
No irrigation system is perfect or has a 100% distribution uniformity, but 90% is considered excellent. As an example, Anshutz said, testing may have determined a grower’s distribution uniformity was 80%. To many people, 80% is a B grade, which is considered above average and still pretty good.
In irrigation, he said an 80% distribution uniformity means there’s room for improvement that is most likely financially viable. A general rule of thumb in the industry is that for every 1% improvement in distribution uniformity, growers can expect a 0.5% improvement in yield or more, he said.
Cory Broad, a Fresno-based regional and agronomy sales manager for AvidWater, said he was first attracted to the distribution uniformity and return-on-investment estimator by its simplicity and repeatable results. Being able to provide growers with actionable data furthered its usefulness.
Since the 2014-15 drought, Broad said the irrigation industry has focused mostly on how irrigation systems can save water. But the estimator allows irrigation designers and servicers to take a more holistic approach.
“We still look at (water savings), but we now know the cost of energy to move it, apply the water and the cost of fertilizer applied,” he said.
Describing it as a tool, Broad said the estimator helps quantify the problem for grower-customers and show them why they need to remedy it. The fix could be something as large as upgrading to a variable-drive pump to something as small as system remediation that involves running chlorine shock for four hours to clear lines and emitters, followed by a two-hour flush.
As a Fresno-based licensed professional agricultural engineer, Anshutz developed a series of complex spread sheets to estimate how much reduced distribution uniformity was costing producers in wasted energy, water and fertilizer. It also factored in potential yield improvements. The spreadsheets were the basis for the distribution uniformity and return-on-investment estimator.
“You could say, ‘Hey, you’re at 20% less than you could be,’” he said. “That means you’re potentially overapplying 20% of your water, fertilizer and power. Here’s how much you’re possibly wasting, and here’s how much yield you’re possibly forgoing. Combine the two, and here’s basically how much you could afford to spend to fix it.”
In his AGH2O consulting business, Anshutz would take it further and draft retrofit designs to improve overall system distribution uniformity. The improvements may have cost $500 per acre based on estimates from partnering irrigation dealers, but the grower may save $750 per acre.
The new simplified distribution uniformity program is based on sampling just one representative block in an orchard or field and taking significantly fewer pressure and flow measurements overall than the existing standard procedure. Typically, a two-person team can finish sampling in four to six hours, depending on emitter types and flow direction, Anshutz said.
The program walks system evaluators through previsit questions as well as where to collect flow and data. After the collected data is entered into the program, it generates a comprehensive report as a PDF file to print or download and send to the grower. Compared to the Cal Poly protocol, the simplified distribution uniformity results have been found to be within 1% to 2%, which Anshutz considered statistically sound.
“The advantage here is that we can find out for the grower whether they’re in the ballpark of good or in the ballpark of bad,” said Bisconer, a managing member of Surf ‘N Earth Enterprises in Cardiff. If producers receive excellent scores, they don’t need to do anything further.
“But if they’re in the ballpark of bad, well then, let’s dig a little deeper and find out how much money they’re really leaving on the table in terms of water, energy and fertilizer loss, and forgone yield potential,” she said. That may mean the next step is conducting a more comprehensive system analysis using the standard Cal Poly sampling protocol.
With minimal training, he and Bisconer said producers, their workers, resource conservation district employees, consultants and others could conduct the simplified distribution uniformity test. For those who want to learn about the nuts and bolts behind the program, Bisconer also wrote a 600-plus page technical manual.
Anshutz and Bisconer’s work was underwritten by a nearly $500,000 California Department of Food and Agriculture Water Efficiency Technical Assistance program grant awarded to the Coalition for Urban Rural Environment Stewardship in 2022. The distribution uniformity and return-on-investment estimator can be downloaded for free at www.curesworks.org/du_roi_estimator.
Vicky Boyd is a reporter in Modesto. She can be reached at agalert@cfbf.com.

In this edition…
• Labor expenses push farmers to automate
• Policymakers, ag leaders gather to discuss key issues
• Regulatory costs put Napa County wine future at risk
• CCA Today: Managing soil health using biostimulants
• Counties struggle with new abandoned orchard law
• On the Record: How farmers can help fight wildfires
• Virtual workshop on disaster relief funding is July 9
• Local farmers grow malting barley for brewing beer
• How can growers monitor and control citrus scale pests?
• Water uniformity tool helps farmers identify savings
• Fix poor infiltration with gypsum and water tests
• Dial 811 first to protect your land, workers and neighbors
• Advocacy in Action: Farm Bureau tackles New World screwworm, USDA support, fungicide strategy, Colorado River and employment technology
